Know how the agency is doing without building a spreadsheet
Dashboards show revenue, hours, overtime, and fill rates from the same verified data that runs payroll and billing. Ask WaveAI a question in plain English when you need a number, and read Wave Digest on Monday morning for the week in a few paragraphs.

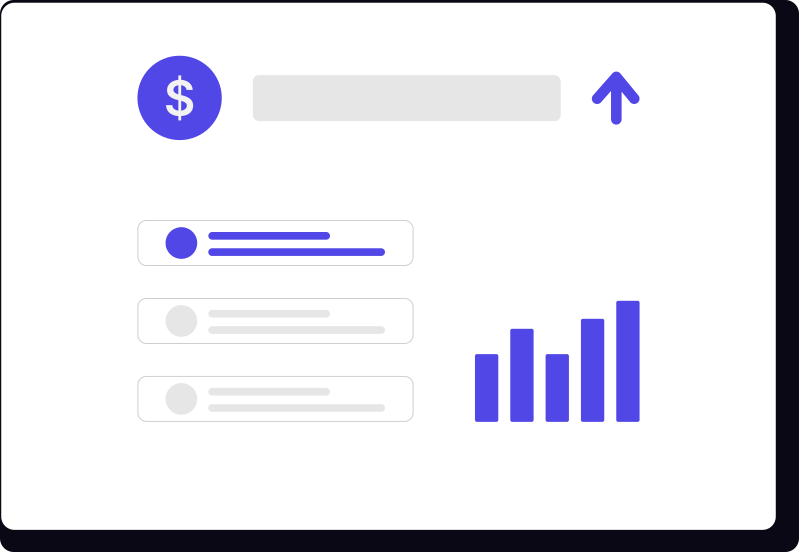
The numbers an owner checks, on one screen
Revenue, billed hours, overtime, open shifts, and fill rate, drawn from the same verified visits that feed payroll and invoicing. Because the data is the same everywhere, the dashboard never disagrees with the invoice. Click into any number to see the visits behind it.
Ask WaveAI the question instead of building the report
WaveAI answers questions about your own agency's data in plain English. "How many hours did we bill last week?" or "Which caregivers are close to overtime?" gets a direct answer from your records. Every Monday, Wave Digest sends the week's numbers, overtime risk, and churn signals as a short, readable summary. It's an assistant, not a decision-maker: you read the answer and make the call.
Spot the caregiver who's slipping and the client who's at risk
Staff ratings, late and missed visits, and hours per client sit next to each other, so patterns show up early. A caregiver whose on-time rate is falling, or a client whose hours are quietly shrinking, is visible weeks before it becomes a resignation or a cancellation. You decide what to do about it; CareWave just makes sure you see it.

See your own numbers on the dashboard
Start a free trial, or book a 30-minute demo and we'll walk through the dashboards, WaveAI, and Wave Digest using scenarios from an agency your size.